Insights
Don’t Just Read It; Experience It With A Story Map.
Anyone that has watched the Game of Thrones opening title sequence has experienced how harnessing the power of map imagery can tell a compelling story. While the GIS and data management professionals at MFA may be unfamiliar with fighting zombie dragons in Westeros, they are no strangers to using maps to tell a compelling story. MFA’s story maps bring technical content to life in a way that is much more exciting than traditional two-dimensional report. Reports are meant to be read. MFA’s story maps provide an experience.
MFA uses Esri’s digital software to combine text, images, and other multimedia content with spatial information to create user-friendly, interactive story maps that can be easily shared online. Story maps not only link information to geography, they take the user on a virtual tour that adds depth to their understanding of the material. MFA’s GIS experts work with clients to understand not only the facts and figures they need to communicate, but more importantly the key messages and tone they want to convey. In other words, to tell a story. The key benefit to the client is that their message does not get lost in the details and their information can carry meaning to a wider audience. Two prime examples of this are the story maps MFA and its subsidiary FLO Analytics created to tell the stories of the Bald Hill Farm in Corvallis, Oregon—which won first place in Esri’s international storytelling with maps contest—and cleanup sites along Bellingham Bay in Bellingham, Washington. In both cases, information collected over several years and associated with large tracts of land is presented in a way that allows users to connect with and easily digest the big picture. The clients were able to convey a sense of place and a connection with their stories.
Experience MFA’s story maps yourself by exploring these examples:
Bald Hill Farm
<project example>
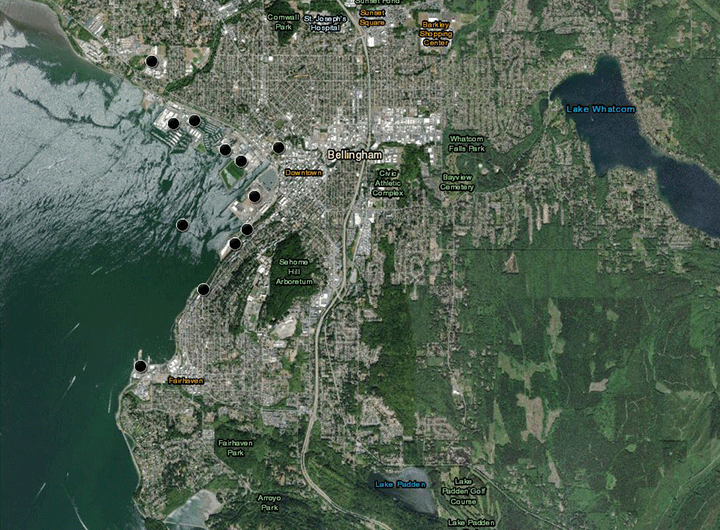
Bellingham Bay Cleanup Sites
<project example>
What’s your story? Perhaps you’d like to share an inventory of industrial properties with potential developers, or catalog the stages of redeveloping your brownfield property from liability to community asset?
To learn how a story map could be used to tell your story, send me a message using the contact form below.